
A local, read-first server console that turns machine telemetry into a control-room display you can understand at a glance.
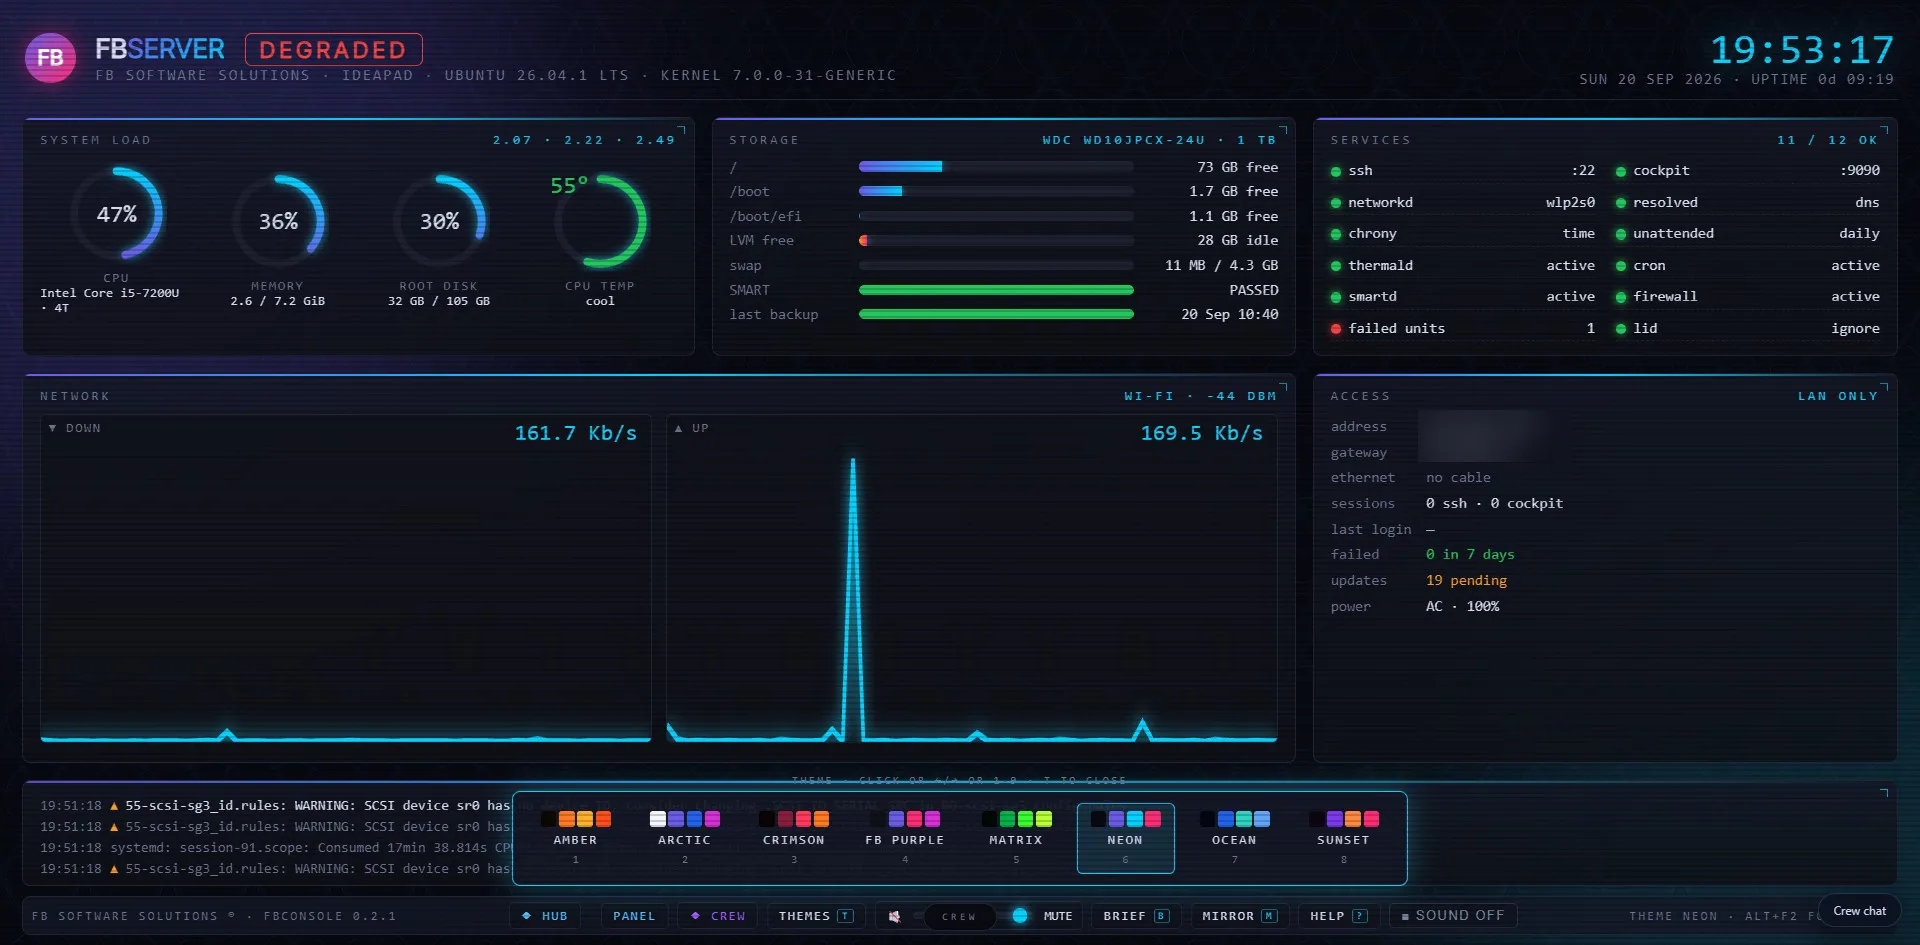
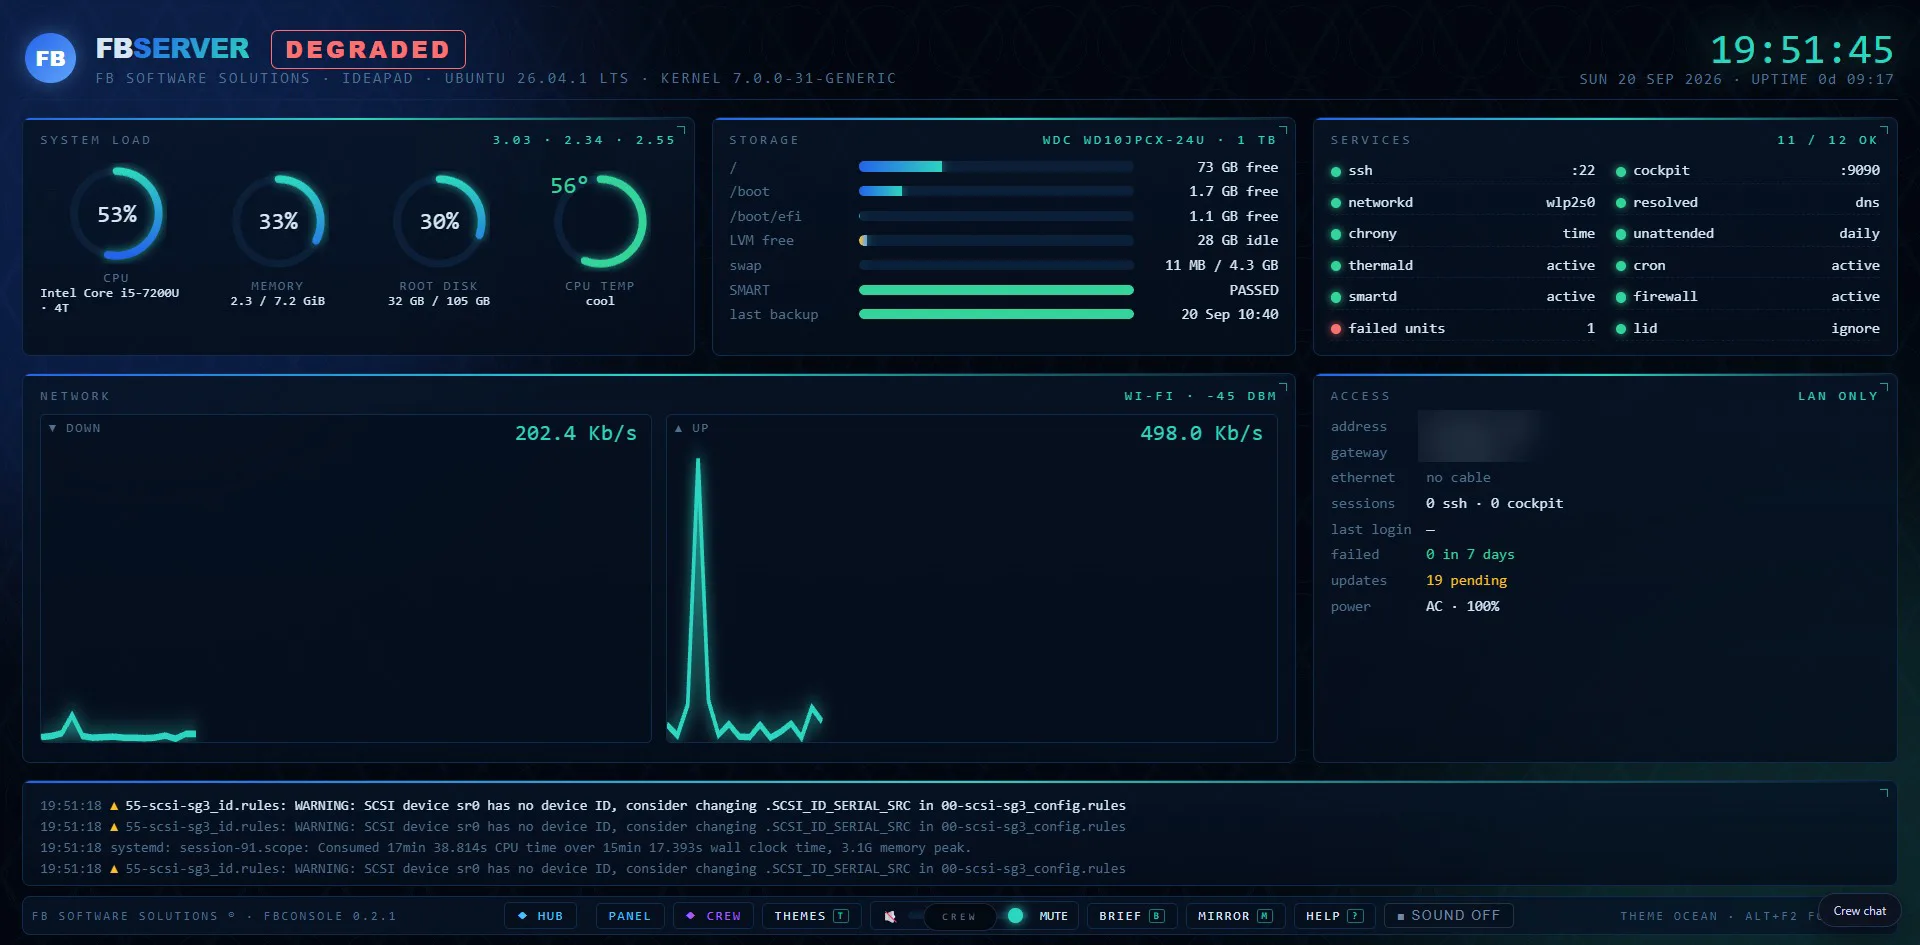
The dashboard is the screen shown on the server itself. It refreshes from the running machine once every second and is designed to be readable from across the room.
Reference machine: Intel Core i5-7200U, Ubuntu 26.04.1 LTS, 1 TB WDC drive, Wi-Fi and laptop AC/battery power reporting.
fbconsole 0.2.1
Once every second
No administrator rights
Observe first; local actions deliberately limited
The screen looks like one application, but collection, serving and drawing are independent layers.
Reads the machine once a second and writes everything into a single readings file. It only reads, and runs as an account with no powers.
Serves the page, its readings and a handful of local buttons. It listens only to the machine itself, not to the network.
Knows nothing about the machine. It fetches the file the collector wrote and draws the current state.
Everything on it was read from the machine a second ago.
Atomic readings. The collector writes a temporary file first, then swaps it into place in one step, so the page never reads a half-written document.
Failure isolation. The collector cannot change the machine, so a display fault cannot become a server fault. The screen can go out of date; it is never the authority.
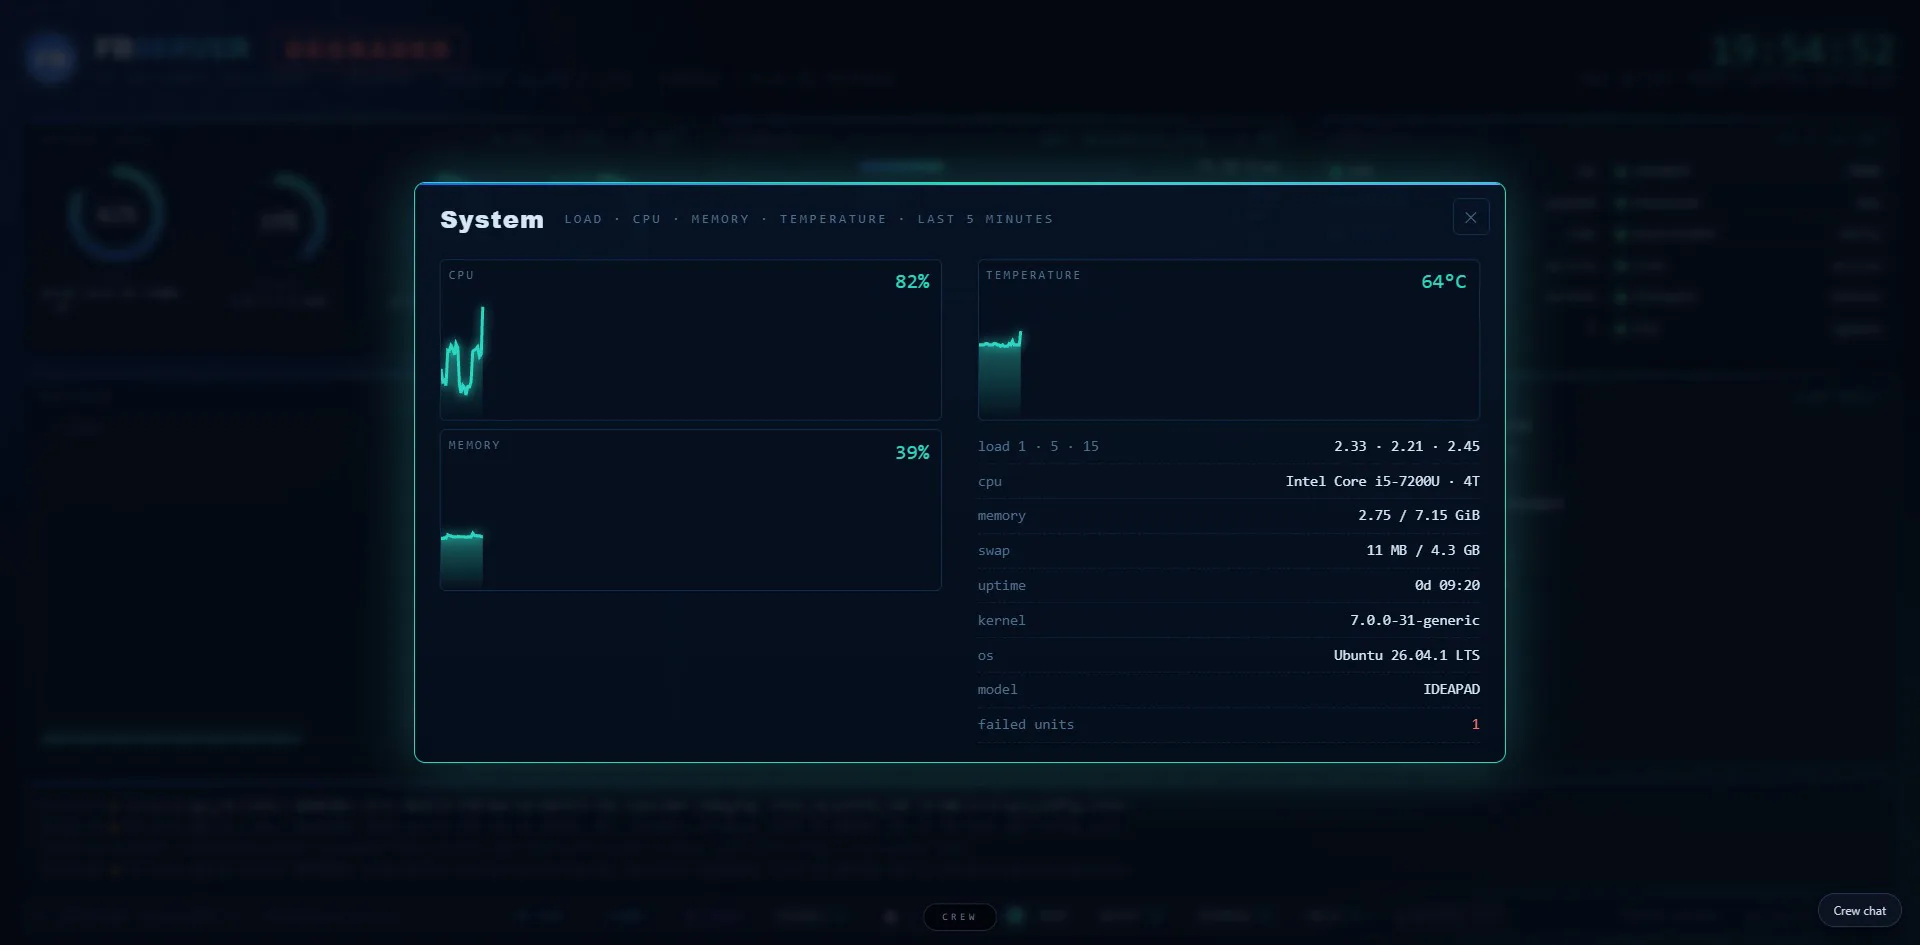
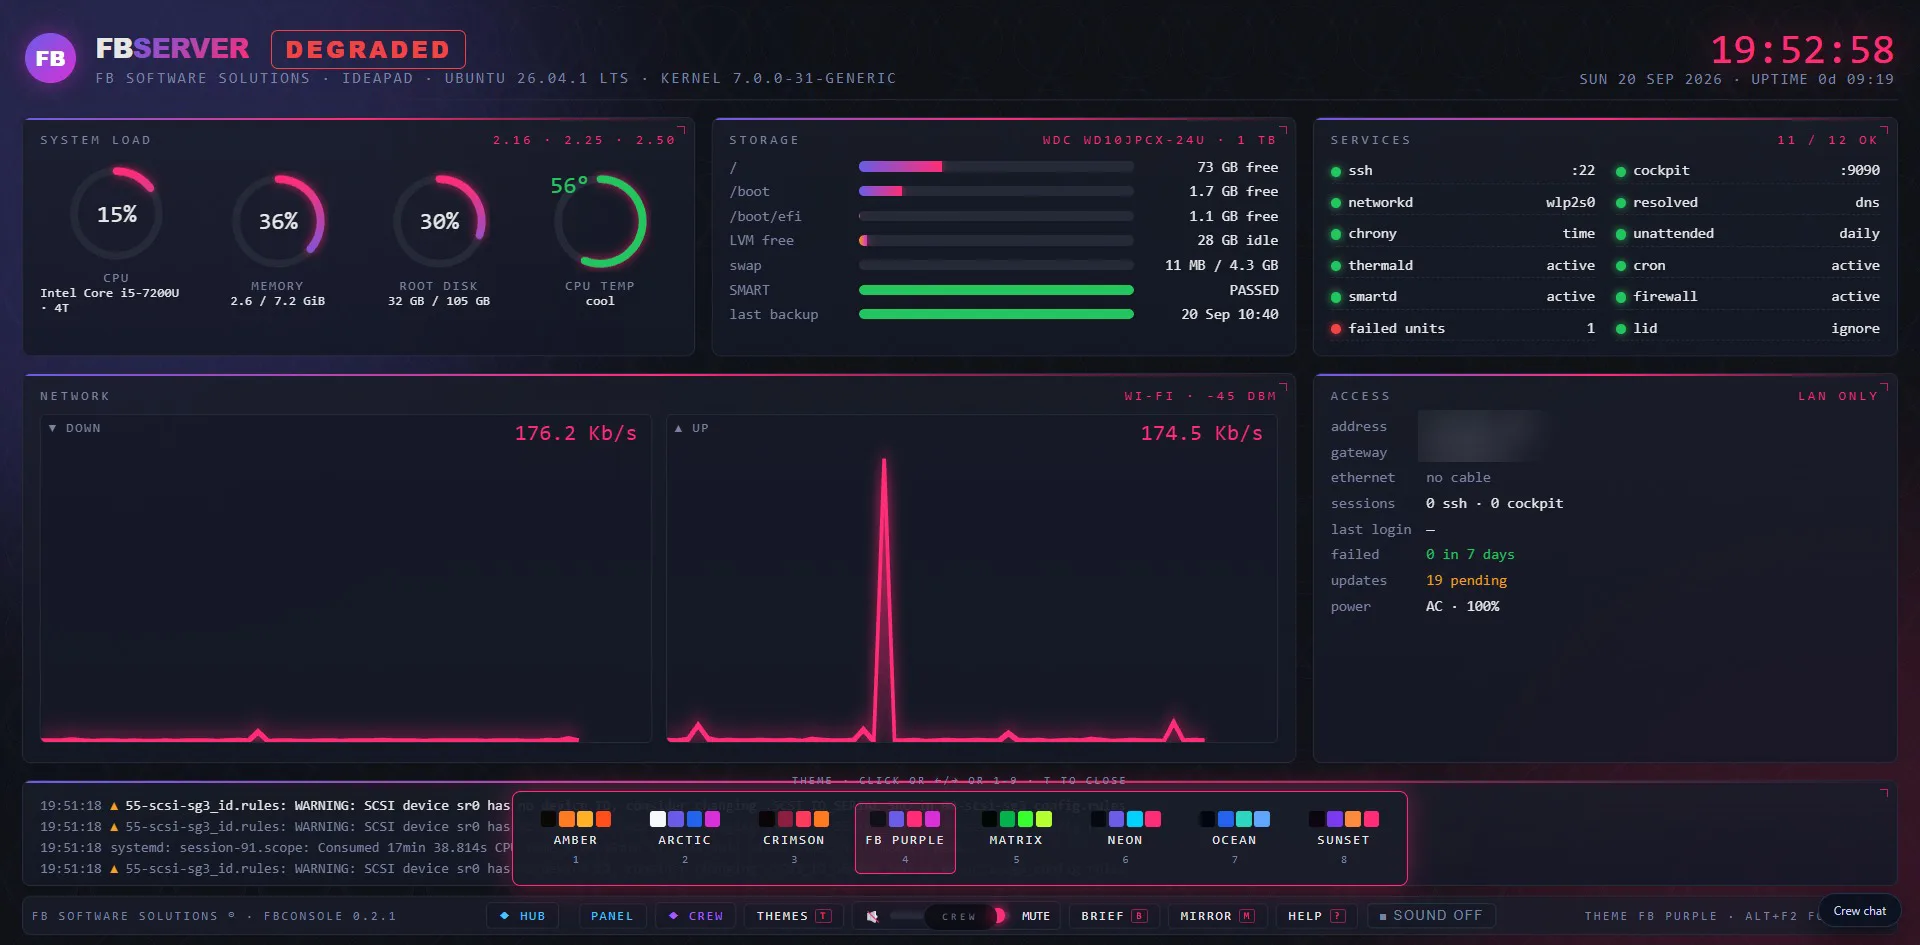
Load averages 1 · 5 · 15 min. Read them against the core count: on a four-core system, a load of four means every core is busy.
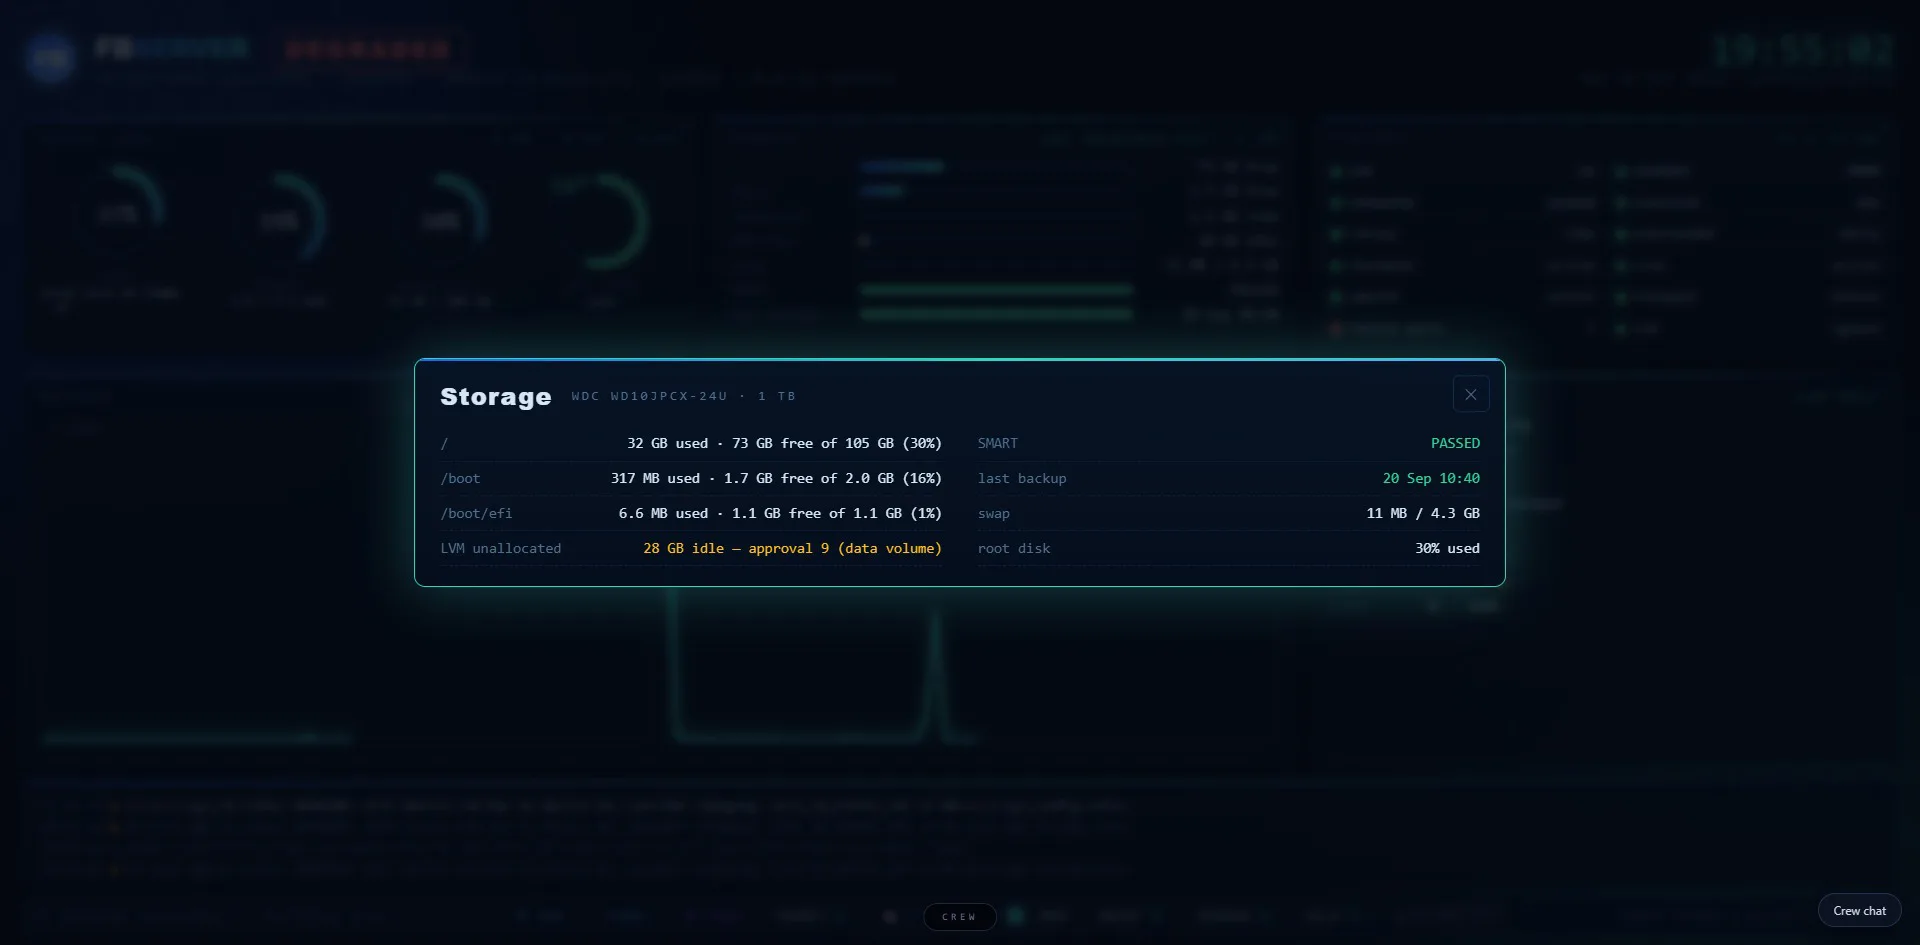
Only genuinely mounted filesystems are shown. LVM free is space that can be given to a filesystem later; swap is disk overflow for memory pressure; SMART is the drive’s own health verdict; last backup is read from the backup tool itself.
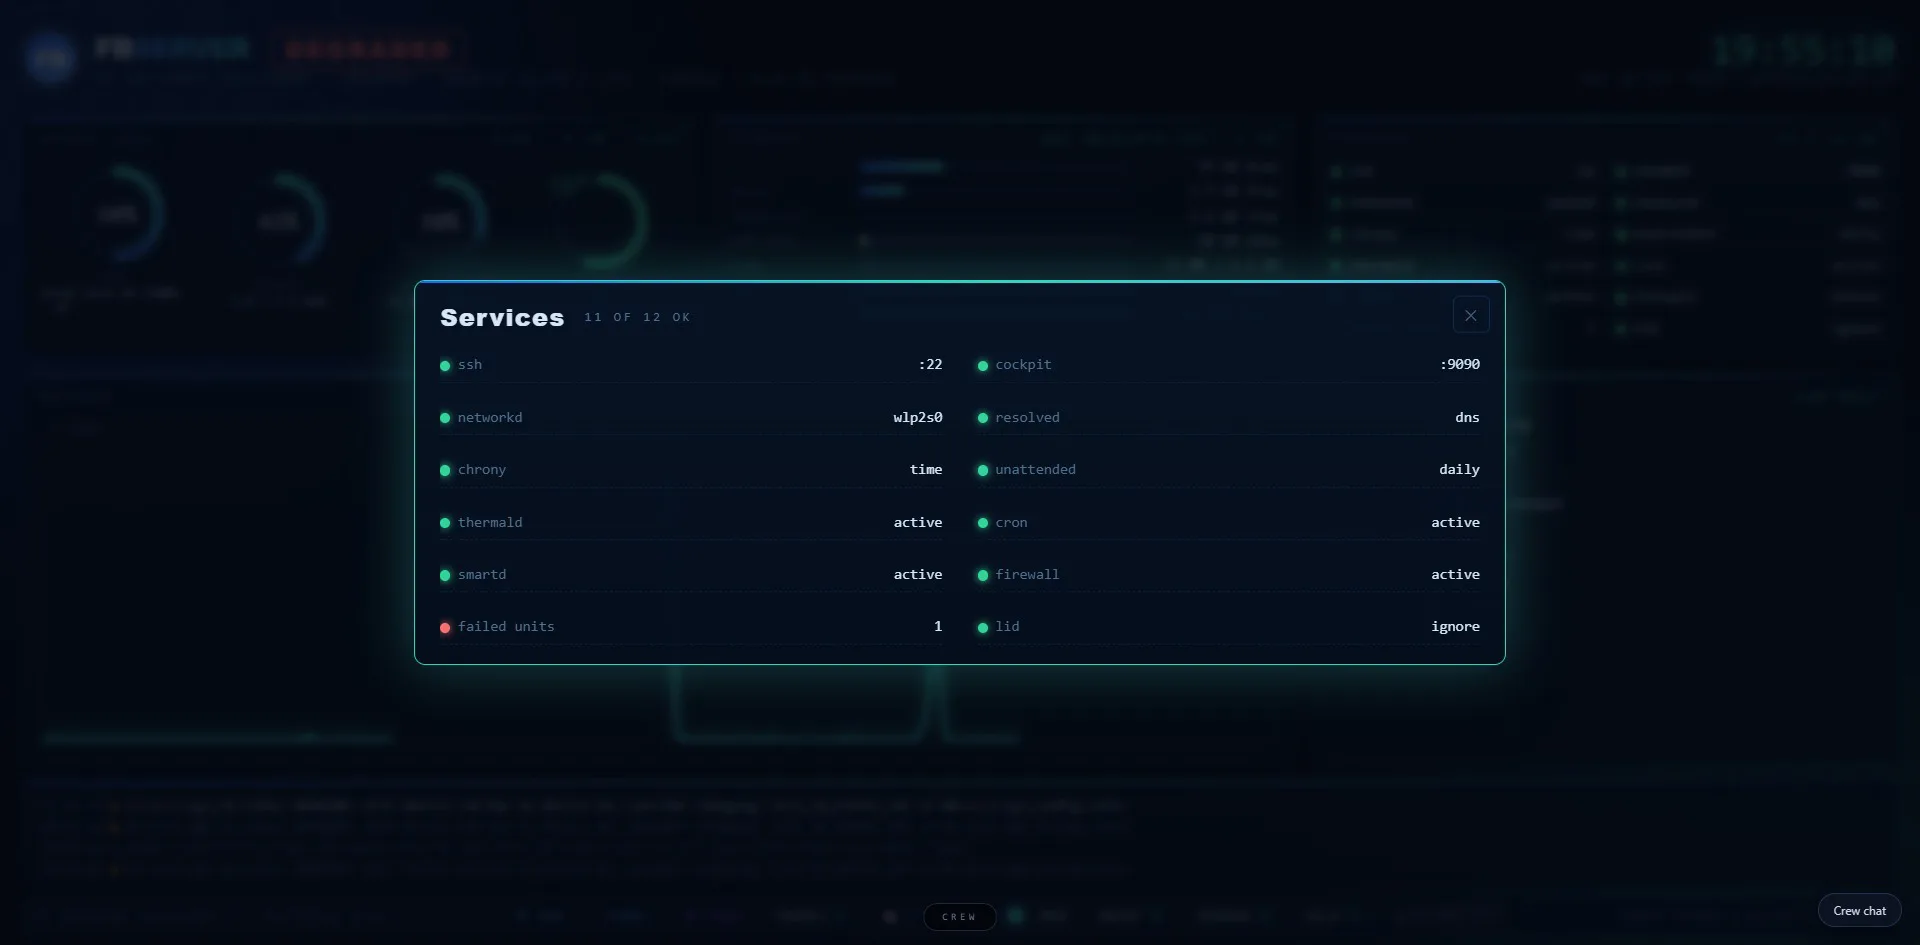
Each row is asked directly whether it is running. Green means yes, red means no, amber means present but not in the expected state.
SSH · Cockpit · networking · name resolution · timekeeping · unattended updates · thermal management · cron · disk monitoring · firewall · failed units · lid behaviour
Download on the left, upload on the right, calculated from bytes moved between readings. Wi-Fi strength is in dBm: negative, and closer to zero is stronger.
Upload higher than download is normal for a machine serving pages to other devices.
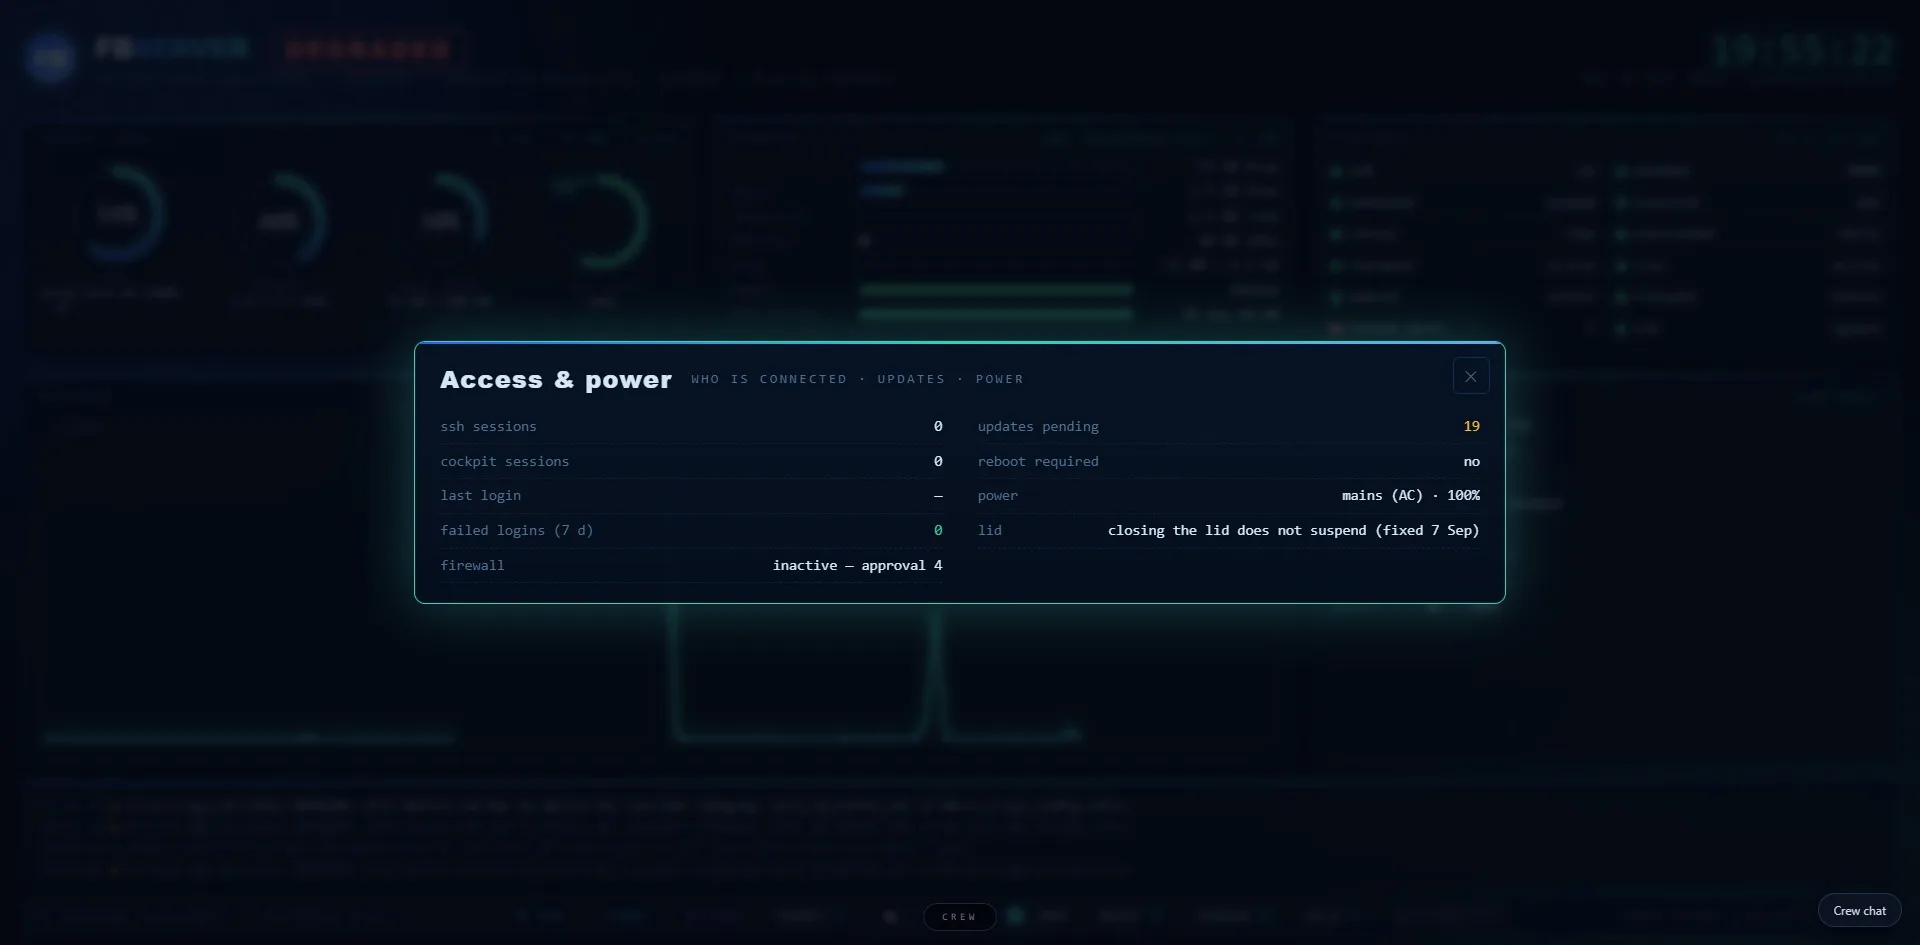
Sessions, last login, failed logins over seven days, pending updates, mains/battery state and lid behaviour. On an unattended machine, remote sessions should normally be zero.
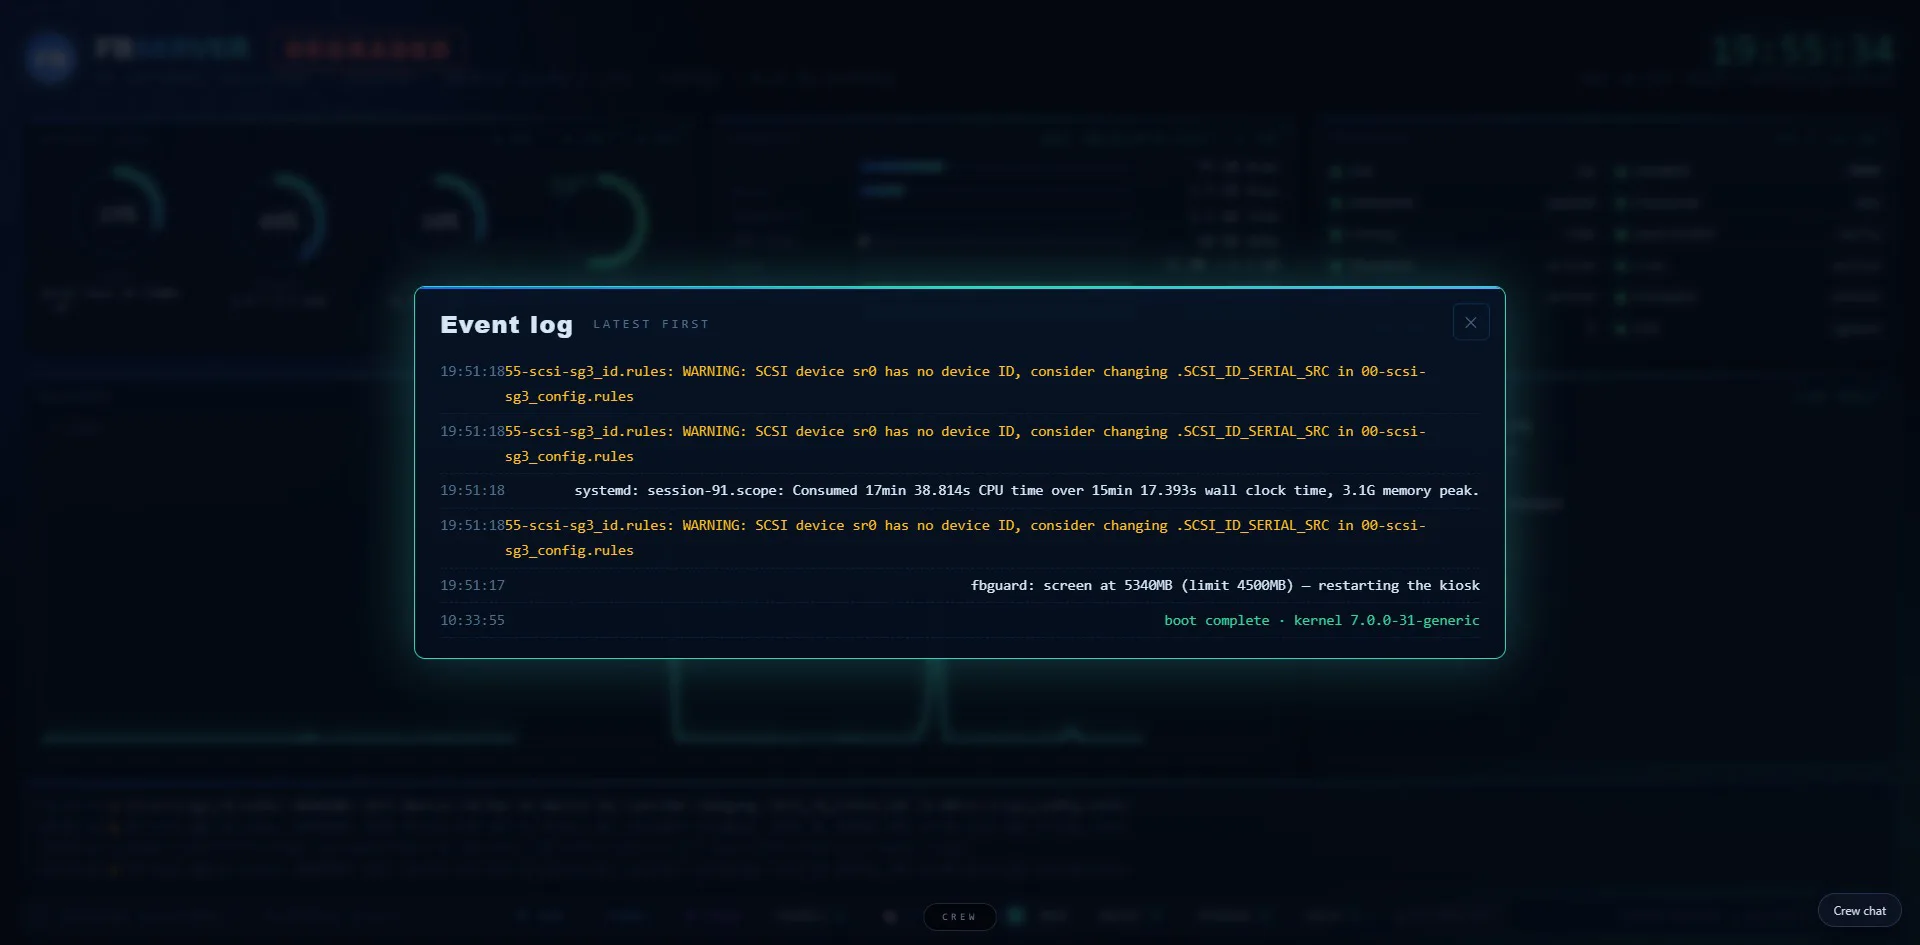
The event strip filters ordinary chatter and keeps notable lines from the system log, plus the watcher’s heat and load notes. The rings show now; the event log shows the last few minutes.
DEGRADED — one comparison, nothing more.
If the number of failed system units is greater than zero, the badge says DEGRADED; otherwise ONLINE. It does not mean slow, hot or unhealthy.
Action: go to the failed-units row in Services, identify the unit, and decide whether it matters.
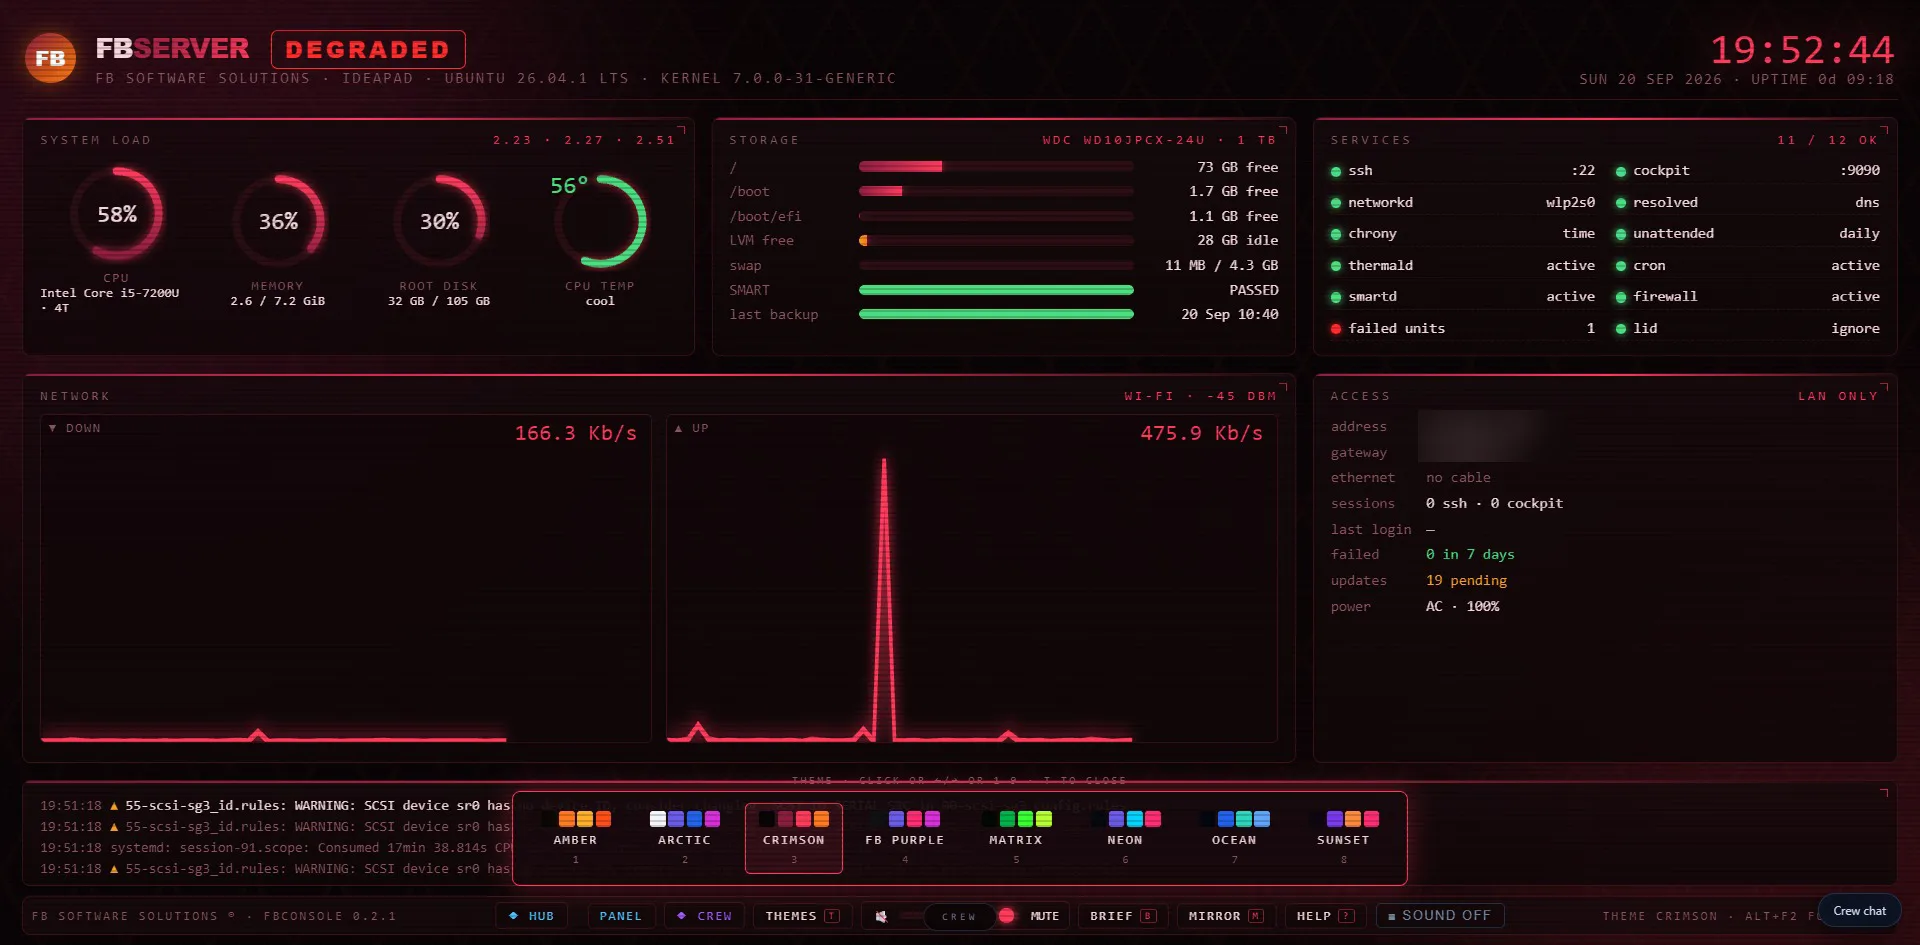
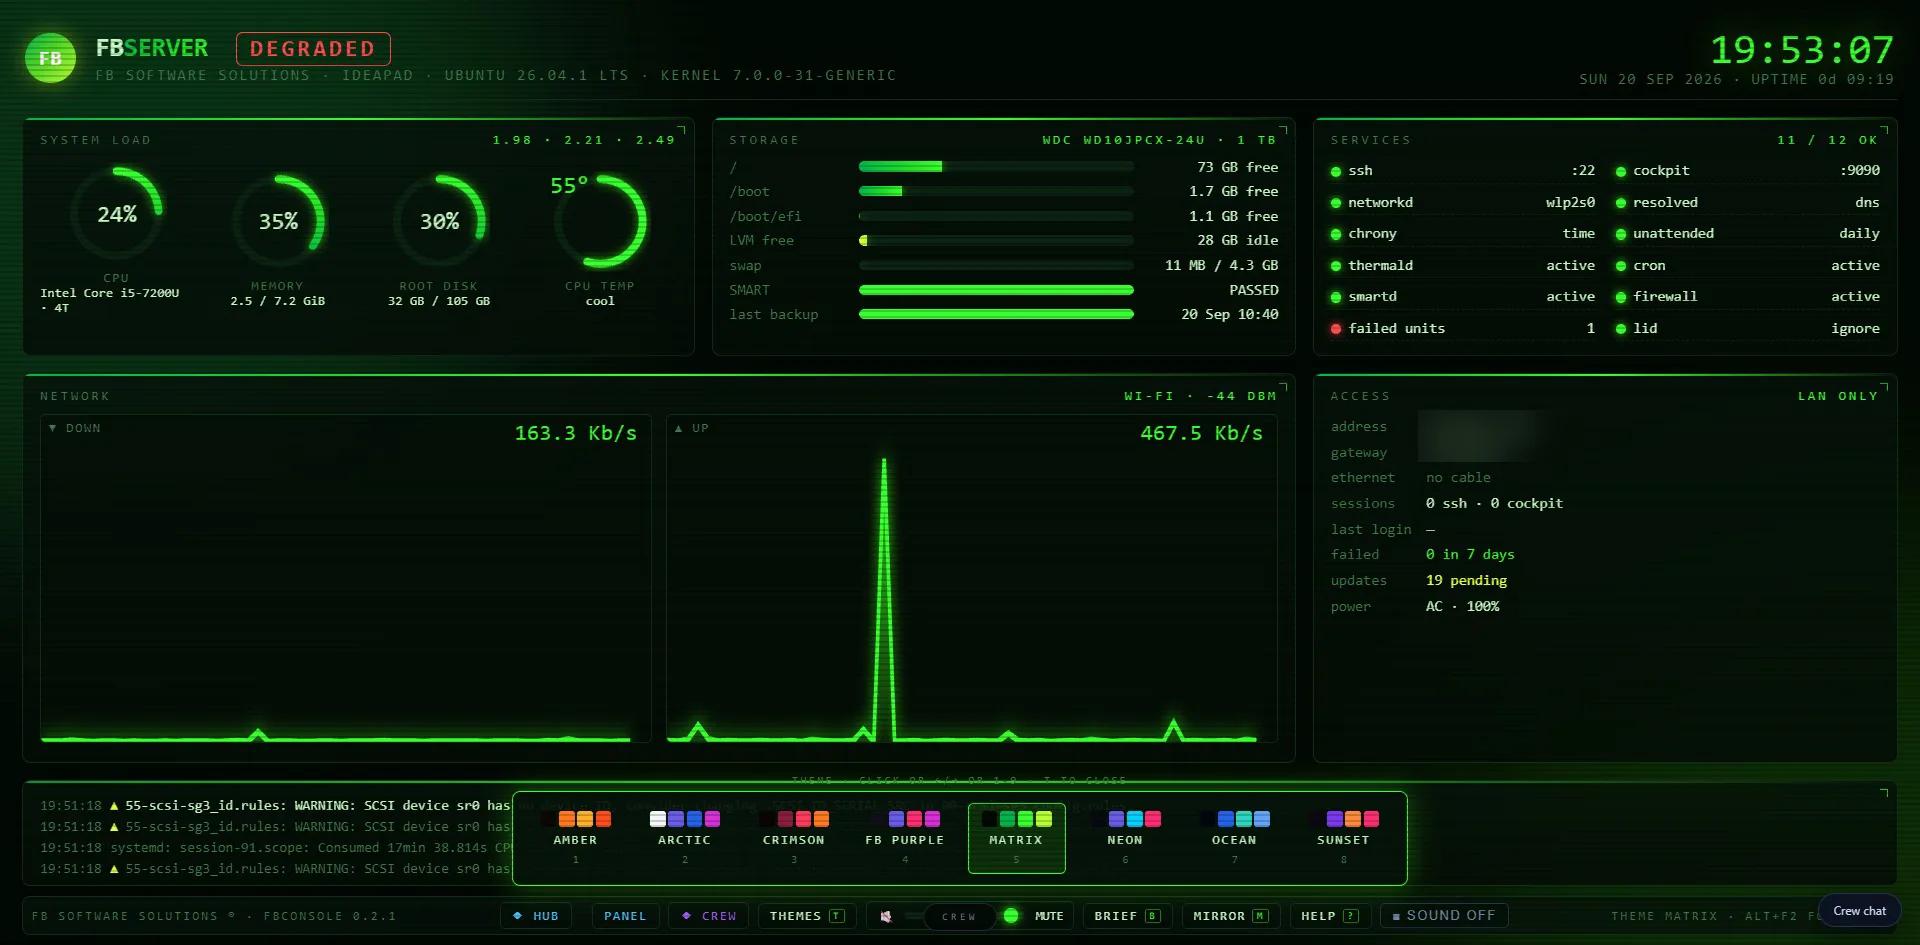
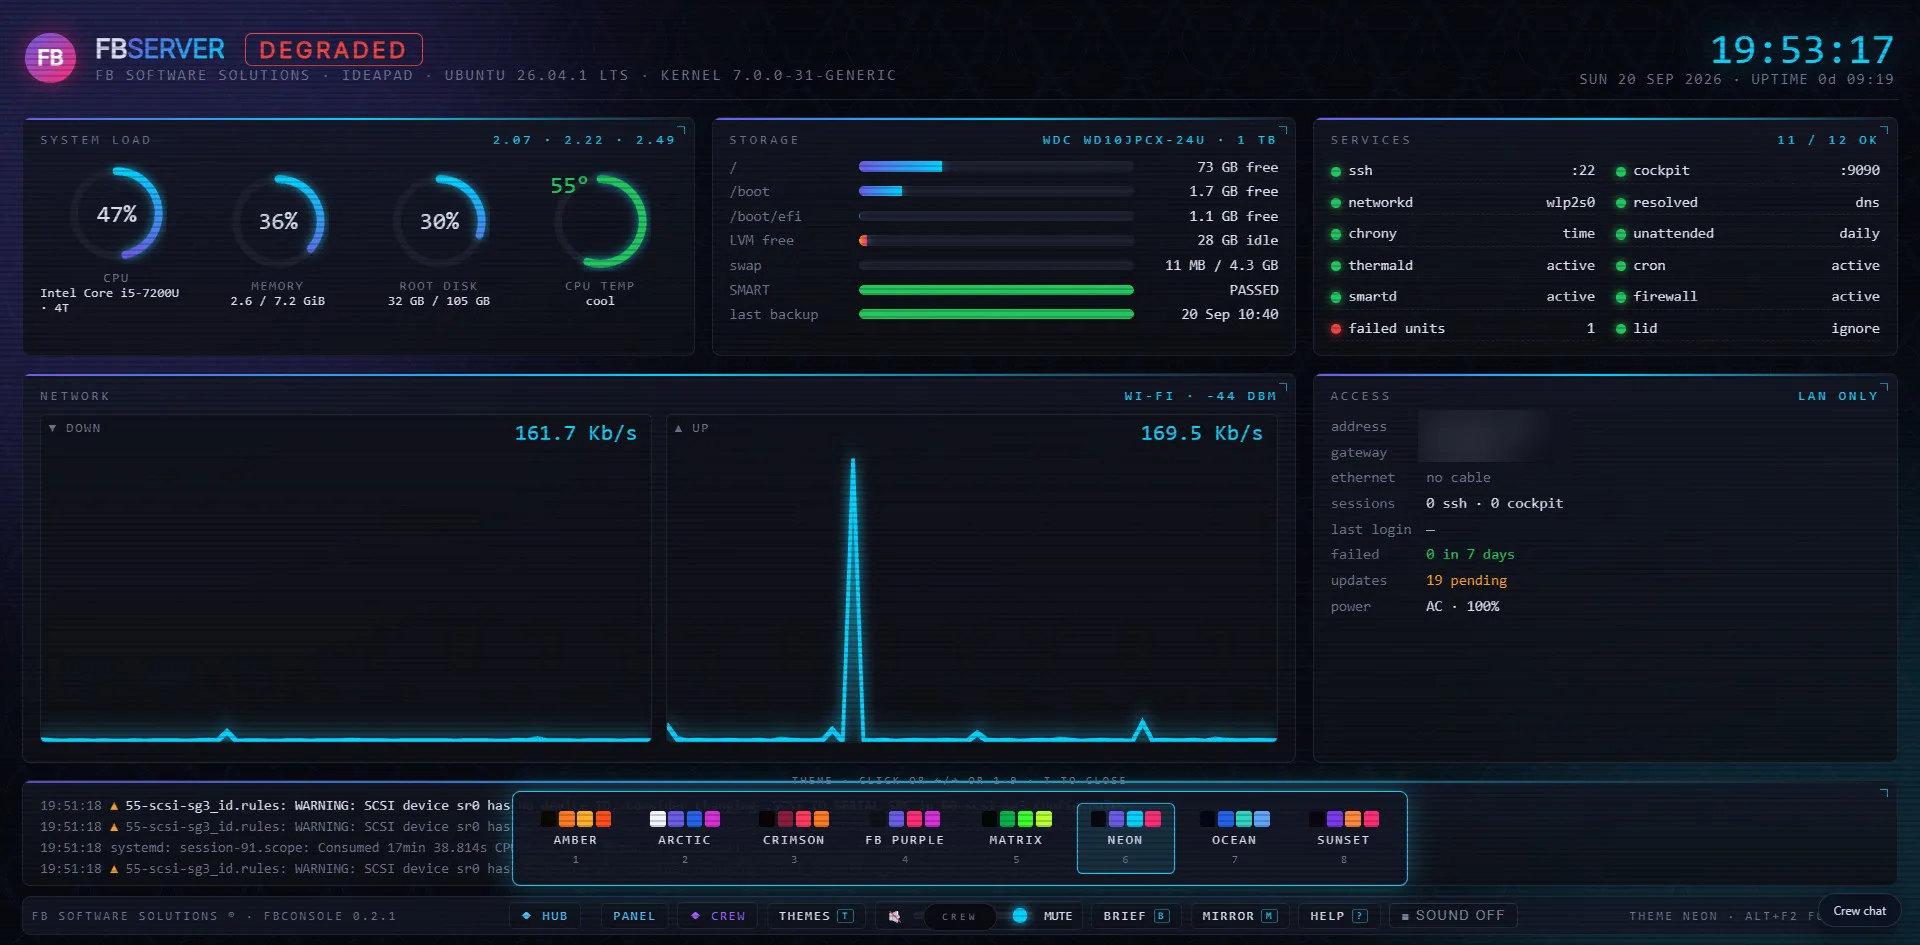
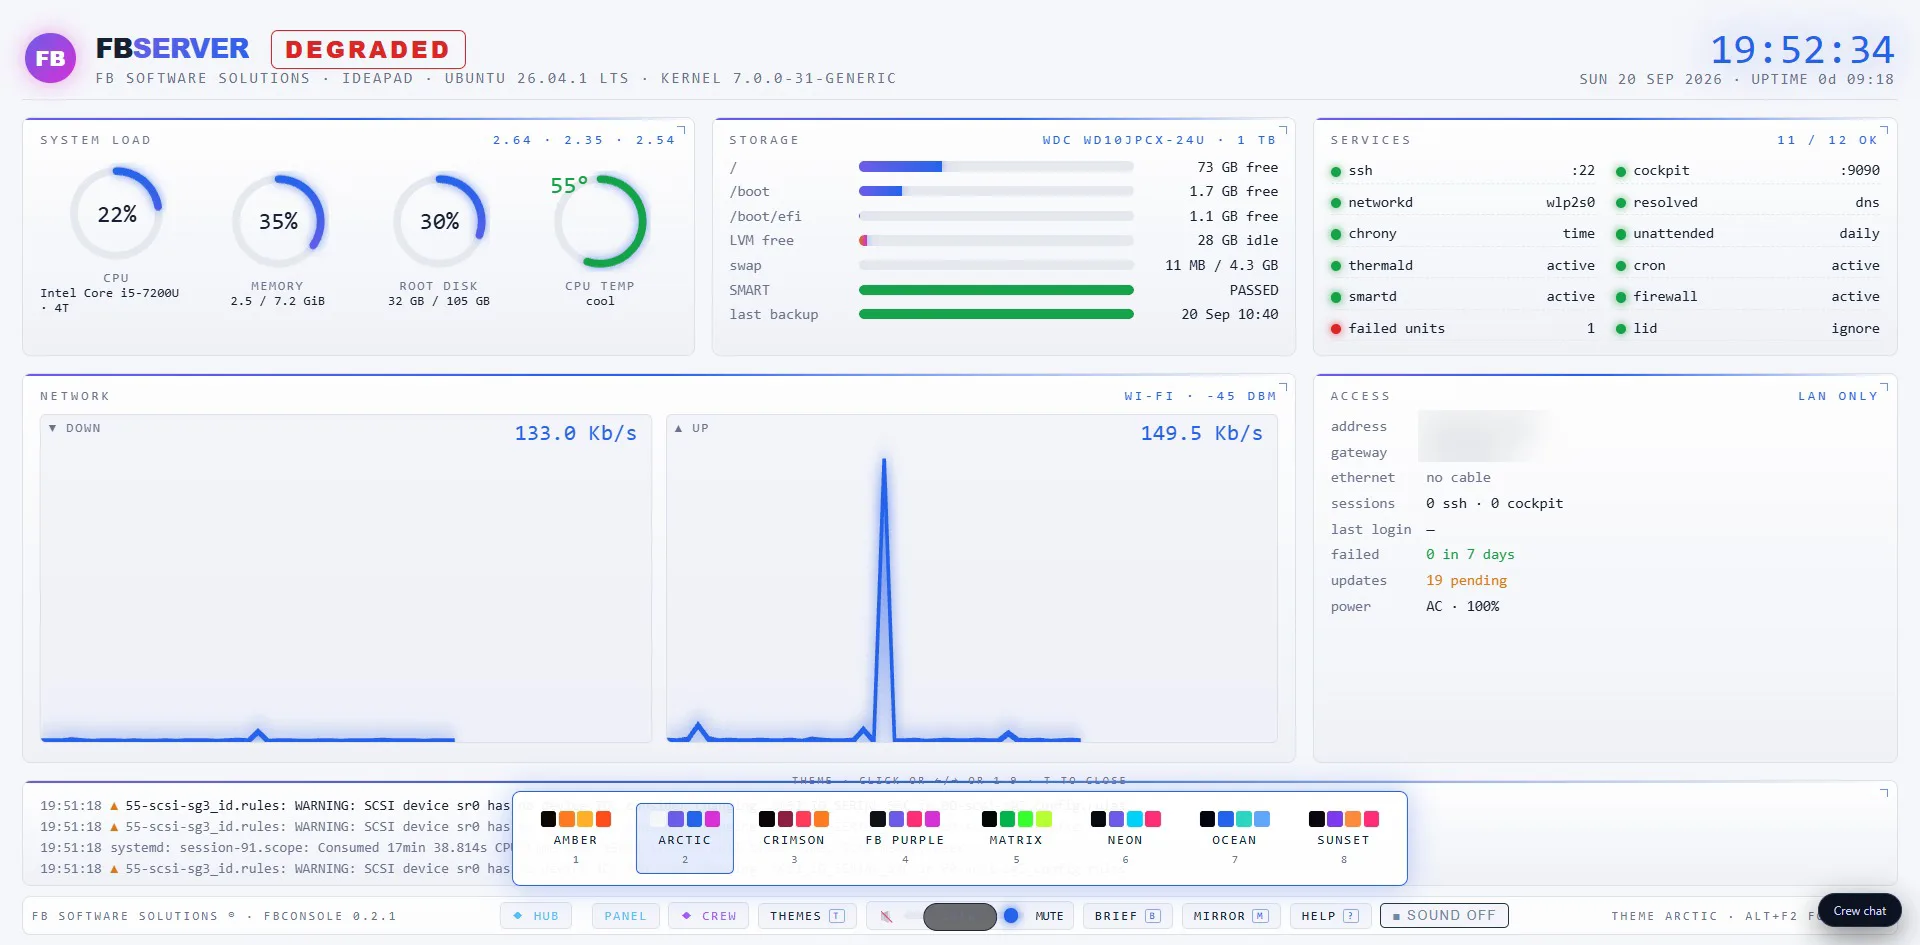
Theme changes apply across the machine’s screens. The layout stays identical while the palette shifts for room lighting, mood or filming. Press T on the server.
| HUB | Open the searchable server knowledge pages |
| PANEL | Open the hosting panel |
| CREW | Open the crew pages |
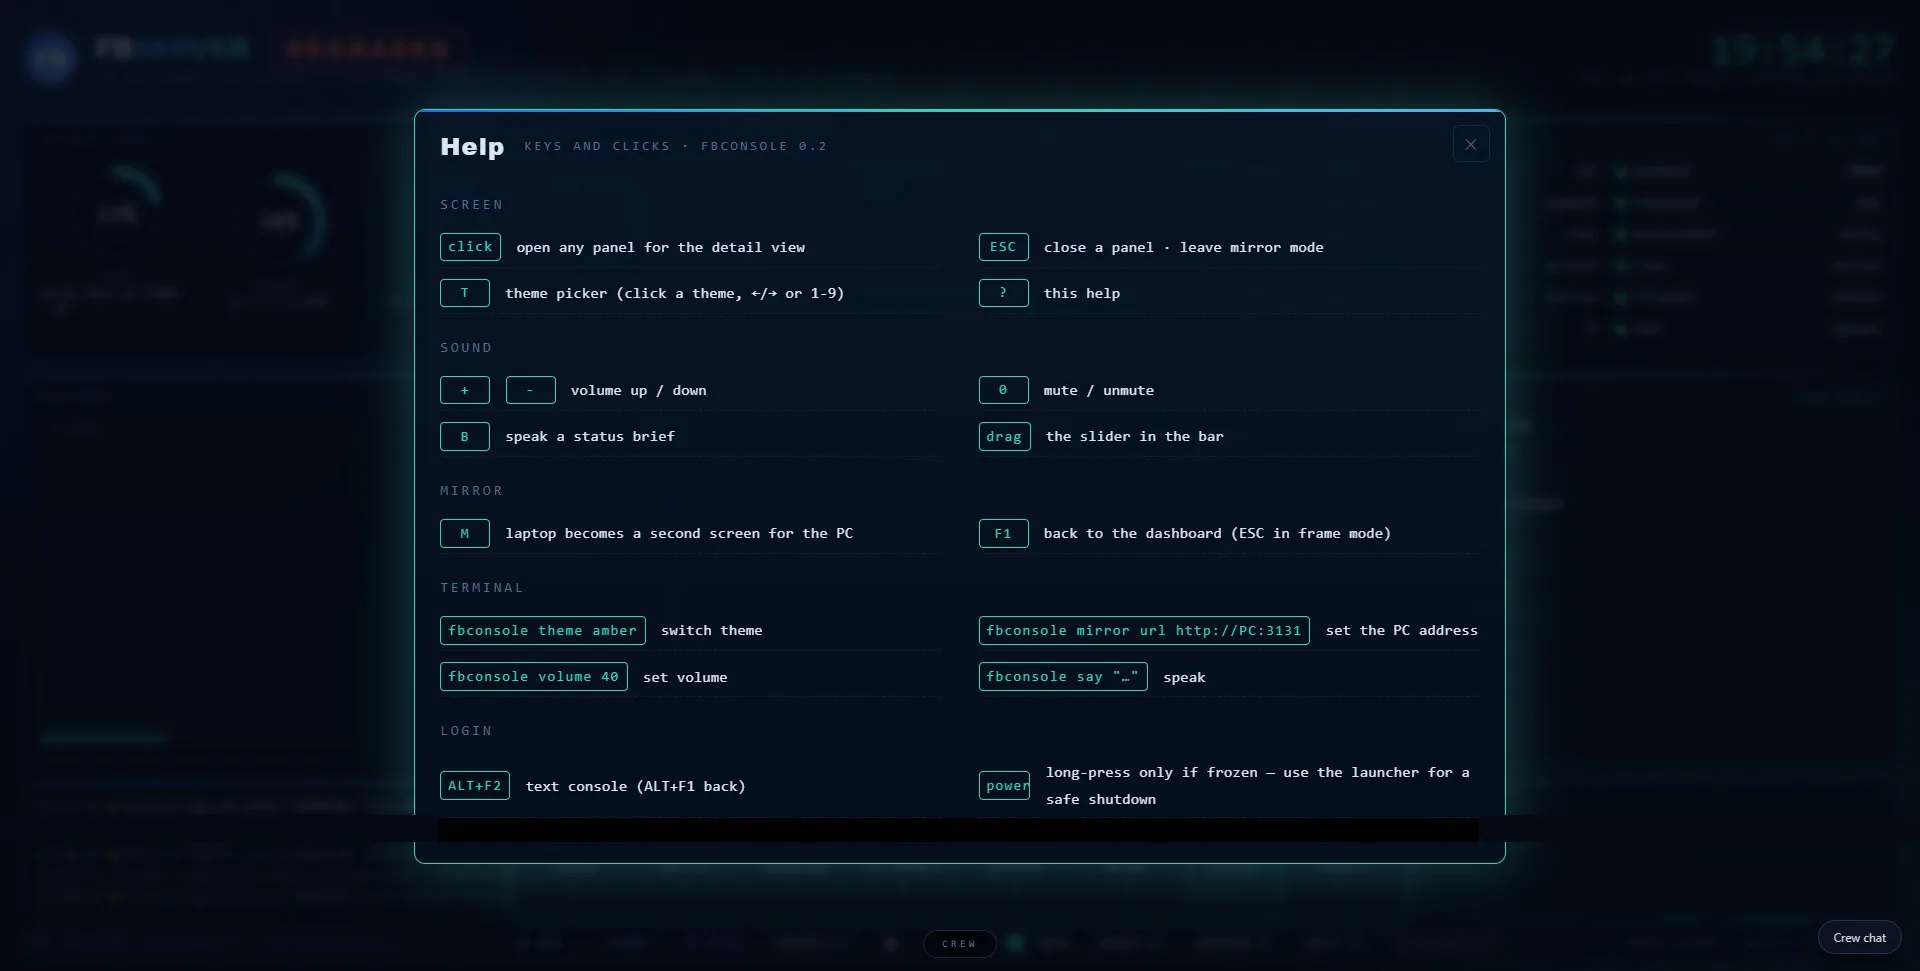
| T | Change the theme across the machine |
| + / - | Speaker volume |
| 0 | Mute or restore sound |
| B | Speak the latest status brief aloud |
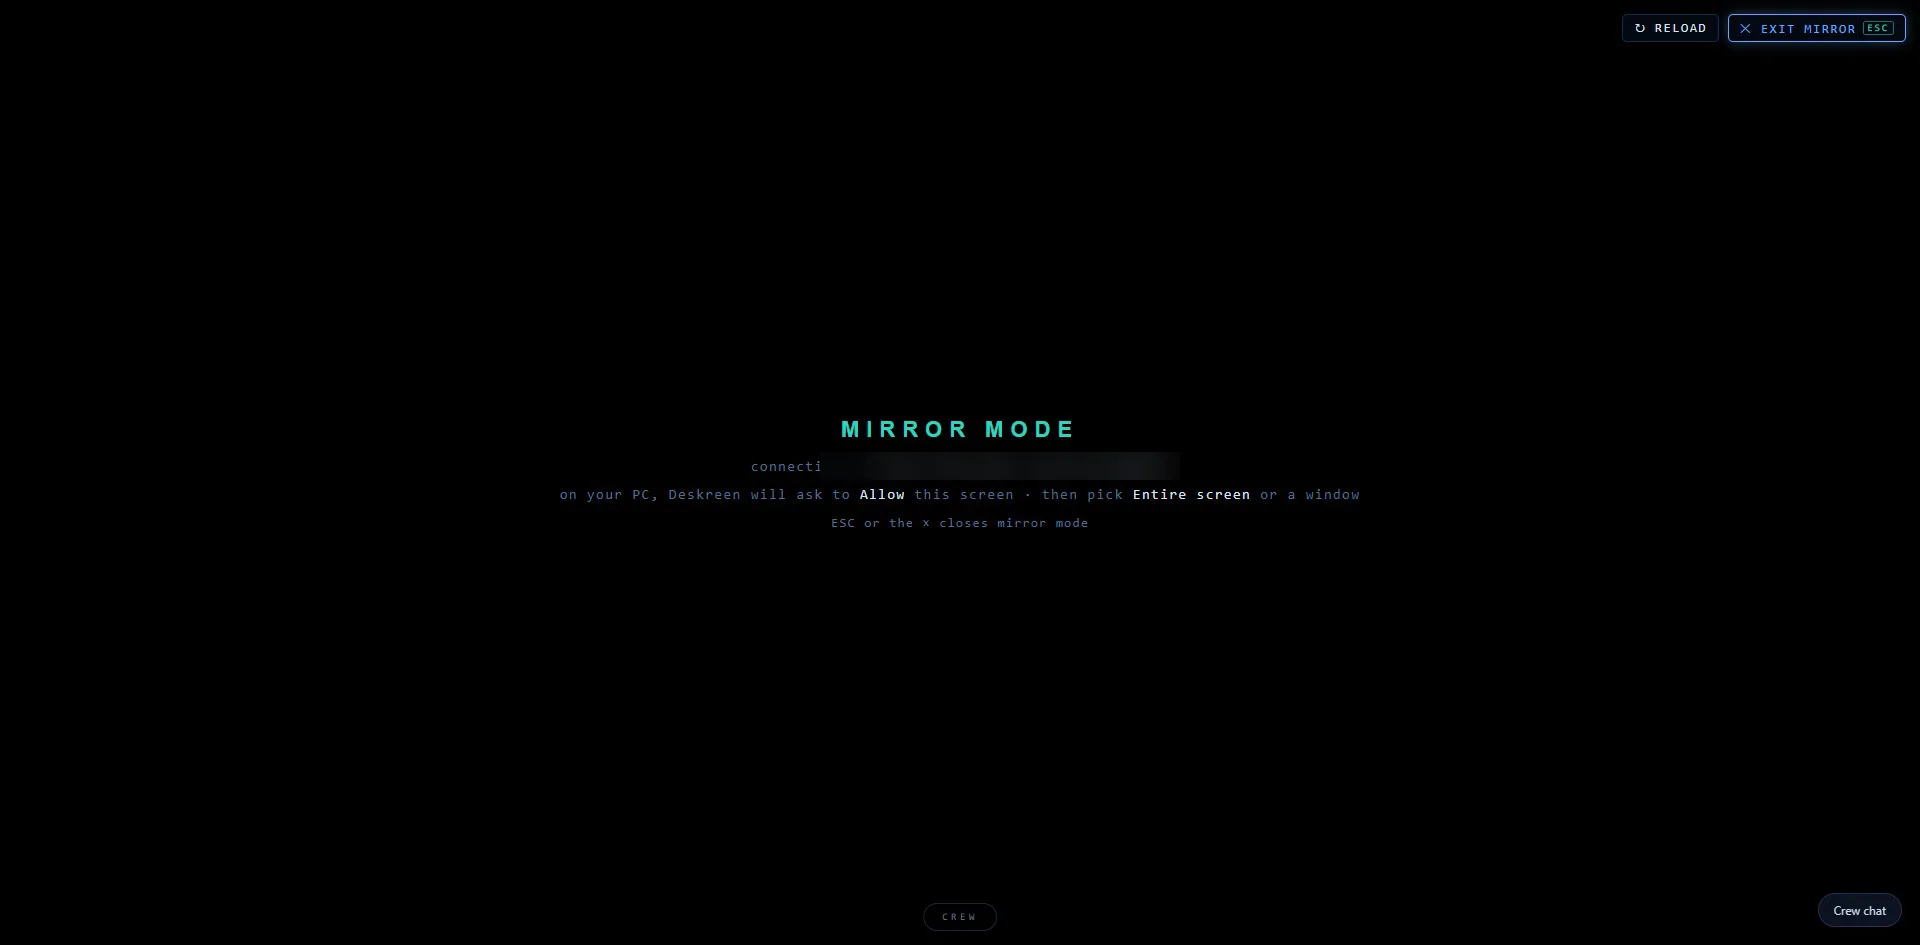
| M | Mirror another screen, or return |
| ? | Open the keyboard map |
Every dashboard panel is clickable and opens a fuller view of the same information.
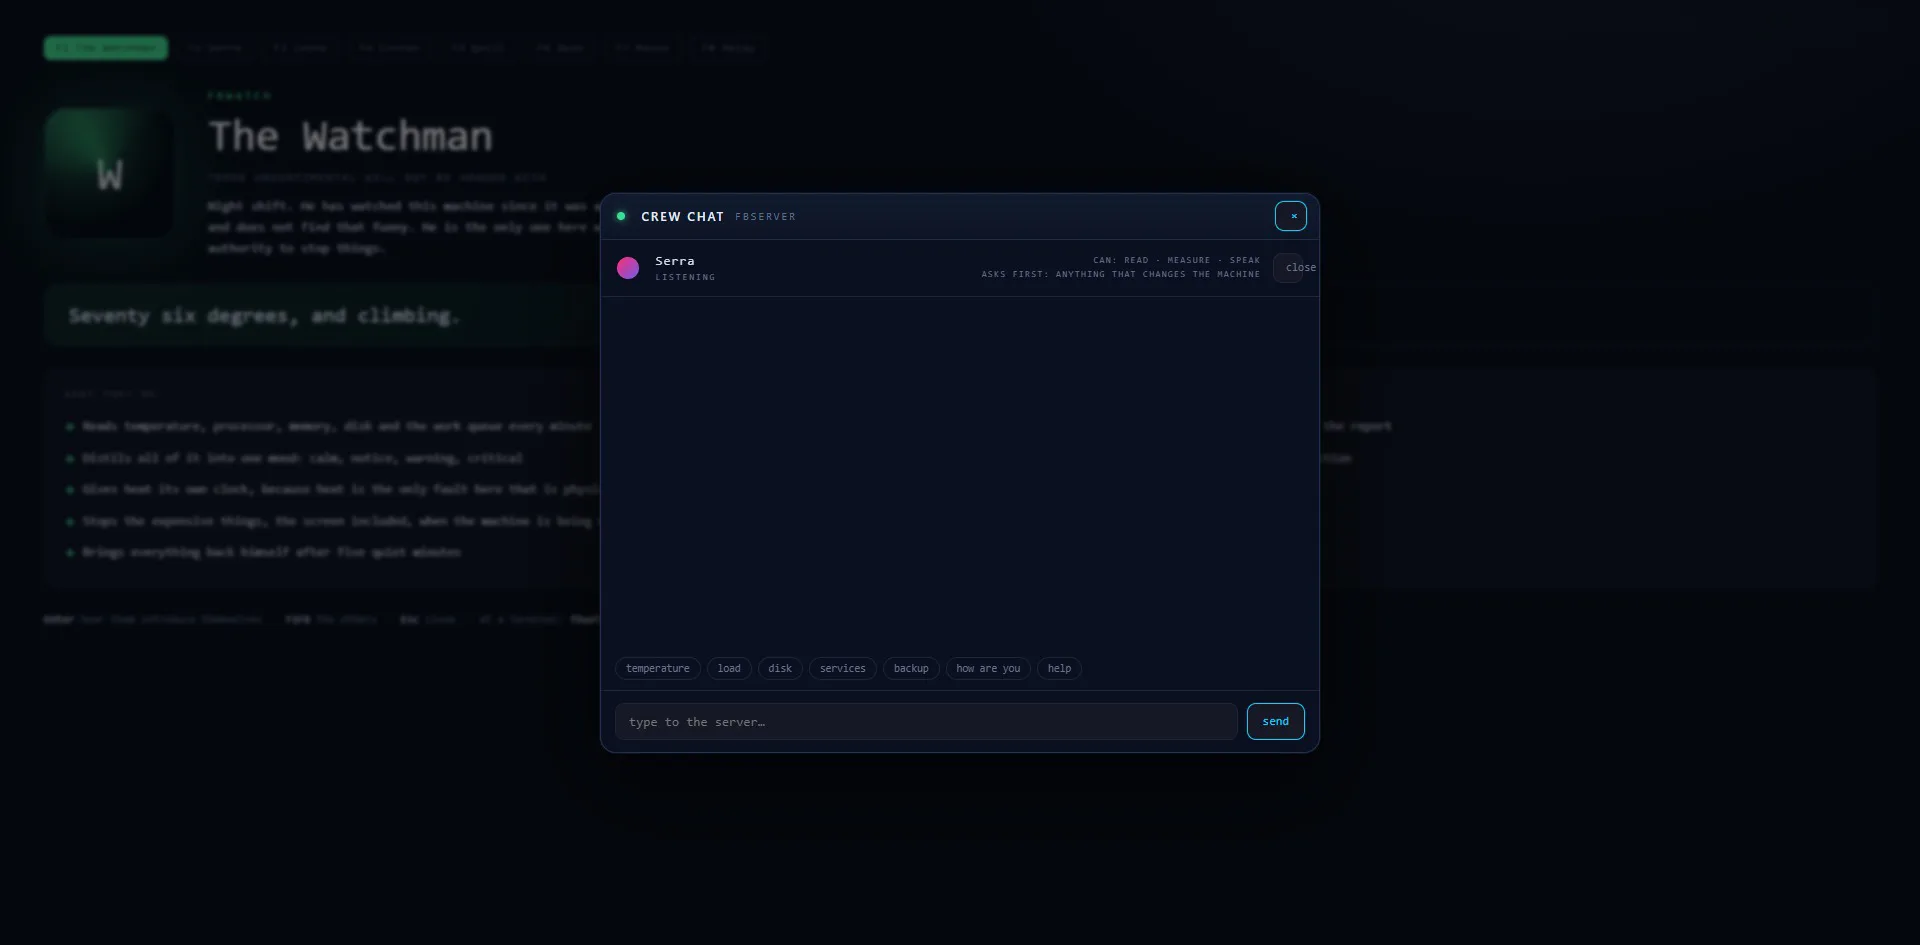
Crew Chat presents Serra as a listening interface with clearly stated capabilities — read, measure and speak — and an ask-first rule for anything that changes the machine.
Design principle: personality can sit on top of telemetry, but the measurements underneath stay explicit, inspectable and separate.
How to read the dashboard when you walk past it.
Runs under an account with no administrator rights.
Only a few named readings get their own privileged command.
The page server listens only to the machine itself.
What other devices see is served separately.
Volume, theme, spoken line and mirror target only.
Theme, crew and project names are checked against a written pattern.
Technical enough to trust, visual enough to understand, and modular enough to grow with the project.
All four system catalogs
Next · Catalog 02
